Prometheus logo

Prometheus

A modern, scalable monitoring system

Prometheus is an open source monitoring system with a very active developer and user community. The design has been inspired by Borgmon, Google's proprietary production monitoring system. Since it’s initiation in 2012, it’s been adopted by many companies.

While most monitoring systems focus on measuring the external behaviour of a system through health checks, Prometheus focusses on measures the internal state of a system by directly accessing the metrics that are exported by the software. Prometheus also makes it possible to configure your monitoring targets dynamically, making it a valuable tool for gaining insight into distributed setups such as software running on a Kubernetes cluster.

The benefits of Prometheus monitoring

100% Open Source Software

Prometheus is Apache 2.0-licensed and has a very strong user and development community. The number of people contributing to the project and it’s popularity continues to grow.

Based on best practices

Prometheus is designed to tackle real problems in real production systems. It is written from the ground up, based on real use cases and experiences at SoundCloud.

Easy to integrate into applications

The Prometheus project provides client libraries that allow you to export metrics in your software more easily.

Battle tested

Though development of Prometheus only started in 2012, its design builds on more than a decade of production experience.

Kubernetes & Prometheus: A perfect match

Both Prometheus and Kubernetes are inspired by internal Google technologies. Prometheus has several key design influences that makes it the best, and most popular monitoring system for both the infrastructure and applications deployed on Kubernetes.

Adopted by the Cloud Native Computing Foundation

CNCF adopted Kubernetes as its first official project. In May 2016 they accepted Prometheus as their second hosted project.

Kumina favorite Prometheus

While setting up Prometheus at Kumina, we developed several utilities for converting metrics provided by existing pieces of software to Prometheus’ format (so-called metrics exporters). Because we at Kumina want to give back to the open-source community as much as we can, we’ve published most of these on Kumina’s GitHub page. We are proud to say we are the biggest contributor in terms of exporters in the Netherlands by now.

Who else is using Prometheus

SoundCloud logo Ericsson logo Percona logo Digital Ocean logo

Blog posts

monitoring containers
What you need to know about monitoring containers
17-05-2017
When adopting a new technology, you will always face some challenges. When it comes to container technology, one of the important questions in this regard is how to get insight in the behaviour of your applications and container environment. Which features are essential when it comes to your monitoring system? Which metrics should processes expose? And what about blackbox and whitebox monitoring? In this article, our Prometheus expert Ed Schouten talks about the monitoring of containers.
prometheus_monitoring
Kumina presentatie over het monitoringsysteem Prometheus bij de voorjaarsconferentie van NLUUG
18-04-2017
Dinsdag 16 mei geeft één van onze medewerkers, Ed Schouten, een presentatie over het monitoringsysteem Prometheus op de voorjaarsconferentie van NLUUG. Kumina past Prometheus toe als monitoring systeem voor haar klanten en heeft diverse exporters (plugins) voor Prometheus ontwikkeld. In de presentatie vertellen we je meer over dit schaalbare en moderne monitoringsysteem. We beantwoorden de volgende vragen: Wat is het datamodel van Prometheus? Hoe komt Prometheus aan zijn data? Hoe raadpleeg ik de data en hoe werkt de querytaal? Hoe genereert Prometheus alerts? En natuurlijk uitleg over hoe wij binnen Kumina Prometheus gebruiken. De speker, Ed Schouten, focust zich bij Kumina op het uitrollen van Kubernetes en Prometheus als vervanging voor de bestaande infrastructuur in Linux-clusters. Hiervoor werkte hij tussen 2012 en 2014 voor Google als Site Reliability Engineer, hier deed hij uitgebreide ervaring op met Borg en Borgmon, waar Kubernetes en Prometheus op gebaseerd zijn.
Using Prometheus to monitor Postfix mail queues
27-02-2017
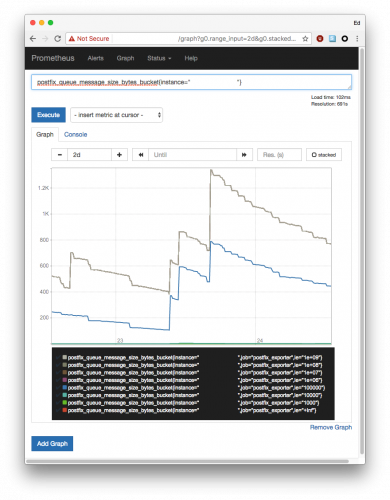
Over the last couple of months we've published several blog posts to announce the release of various Open Source metrics exporters for Prometheus. The development of these exporters is an on-going process at Kumina, as we're working towards replacing our existing Nagios-based monitoring setup with Prometheus. oday we're proud to present to you our own Prometheus metrics exporter for Postfix, written in Go.